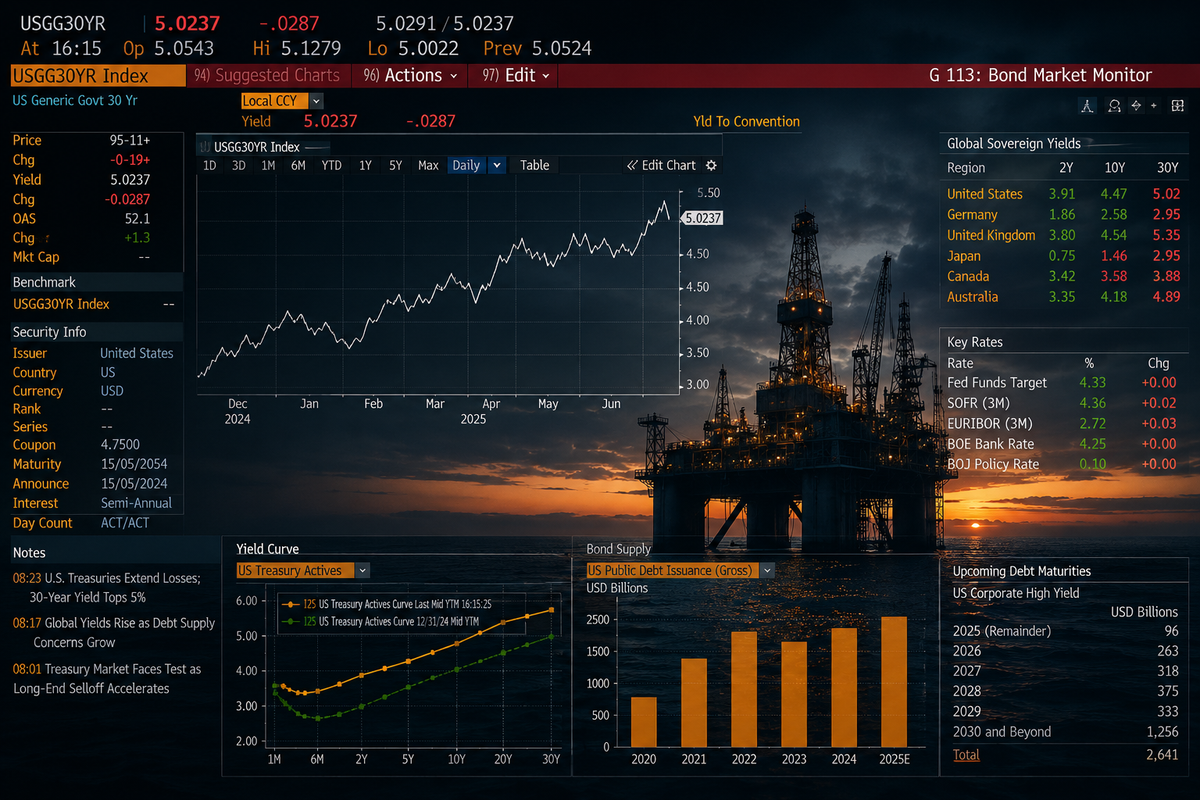
The US Treasury’s rather fruitless attempt last week to take up some of the slack in demand for long-dated government bonds followed a sharp move in a market that normally sits quietly beneath almost every other cost of capital.
Gross US federal debt recently passed $40 trillion. The broader OECD sovereign picture is not especially comforting either, with many governments carrying much larger debt burdens than before the financial crisis. It would be an exaggeration to describe the present situation as an inability of governments to finance themselves. It is better understood as a change in the price at which investors are prepared to provide long-duration capital. A 30-year Treasury yield above 5% looks remarkable against much of the period since the financial crisis, but that period also contained near-zero policy rates, unusually low inflation and enormous central-bank purchases of government securities. The unusually low cost of capital may have been the previous regime rather than the level to which markets will necessarily return.
The end of QE means central banks are buying fewer bonds just as governments are issuing more of them, while some investors that previously had strong structural reasons to own very long-duration debt are changing their behaviour. Elevated public debt and higher real rates are pushing government interest costs materially higher, and fiscal space can contract well before any theoretical debt limit if the market’s willingness to absorb additional sovereign supply weakens.
The phenomenon is not confined to the US. Germany’s shift towards greater defence and infrastructure spending is increasing its borrowing requirement substantially; its finance ministry expects borrowing of more than €800 billion between 2027 and 2030, while federal interest expense is projected to rise from around €42 billion in 2027 to more than €80 billion in 2030. Japan provides an even more striking change in relative pricing. The 10-year JGB yield recently reached 2.945%, its highest level in 30 years, and the finance ministry is considering a 3.8% assumed interest rate for debt-service calculations in its next budget request, up from 3.0%.
Japan also matters directly to the US Treasury market. For years, near-zero domestic yields encouraged Japanese banks, insurers and other institutions to buy overseas bonds, including large quantities of Treasuries. Japan remains the largest foreign holder, with roughly $1.1 trillion, but a 10-year JGB yield close to 3% materially changes the relative-value calculation, particularly after currency hedging. Japanese institutions have less reason to keep extending duration in the US when domestic government bonds now offer a much higher risk-free return. Japan is not causing the US fiscal problem, but it may be weakening one of the mechanisms that previously made it easier to finance. The US is issuing more debt at the same time that one of its most important foreign buyers has a stronger reason to keep capital at home.
The effect on public finances arrives slowly. A government bond issued at 1.5% still costs 1.5% until maturity, so the effective rate on the sovereign debt stock adjusts much more slowly than current market yields. Governments that termed out substantial amounts of debt during the low-rate period still benefit from that funding today, but successive maturities gradually convert historic financing costs into current ones. With a sufficiently large debt stock, modest changes in the average effective rate eventually become very large fiscal numbers.
The present Middle East conflict has complicated the market because higher energy prices are adding to inflation risk. The monetary-policy effect depends not simply on the initial price move but on its persistence and second-round effects. That can delay rate cuts or require tighter policy.
Energy prices are not, however, the whole sovereign-yield story. Fiscal risk can move sovereign yields independently of oil and near-term inflation as investors demand greater compensation for holding long-duration government debt. There is already practical evidence of that separation. In late 2024, oil prices fell materially while the US 10-year Treasury yield rose by almost 70bp following a Federal Reserve rate cut, with the divergence increasingly attributed to fiscal expectations and Treasury supply rather than an oil-driven inflation shock. For oil and gas companies, there is no requirement that an expensive sovereign bond market comes with an oil price high enough to compensate producers for it.
For corporate borrowers, the government or swap curve is only the starting price of money. The final cost is the relevant base rate plus the company’s own credit spread, and the effect reaches different borrowers at different times depending on whether debt is floating, fixed or approaching maturity. The current pressure in government bond markets is particularly visible at the long end, so a rise in 30-year Treasury yields should not be confused mechanically with an equivalent rise in SOFR or EURIBOR. A 200bp increase in relevant base rates is nevertheless a useful stress case because it shows how differently liability structures respond.
Floating debt transmits the change quickly. Revolvers, acquisition bridges, reserve-based lending facilities, leveraged loans and much private credit are normally priced over short-term reference rates. Subject to hedges, caps and contractual floors, a company with $1 billion drawn at SOFR plus a spread incurs roughly another $20 million of annual cash interest if SOFR rises 200bp. Nothing has to mature for that cost to arrive. For a leveraged borrower, higher interest reduces free cash flow, slows deleveraging and can eventually worsen the credit spread offered at the next refinancing.
Fixed-rate debt behaves differently. A 2% bond remains a 2% bond until it matures, so financing raised during the low-rate period can remain economically valuable for years after markets have repriced. The exposure sits in the maturity profile rather than current interest expense. A company can report a benign average coupon while facing a much higher marginal cost on the next dollar of debt. Credit markets remain open and rated issuance has been strong; for most investment-grade companies this is not primarily a story about an inability to refinance, but about the price at which refinancing occurs.
Lower down the ratings spectrum, price and access begin to merge. An A-rated borrower may experience something close to the movement in the underlying government or swap curve if its spread remains stable. A B-rated borrower can face a 200bp increase in the base rate at the same time as its own spread widens by another 200bp, 400bp or more. For a distressed issuer, the spread can overwhelm the base-rate move entirely. A bond due in 2028 is therefore not necessarily a 2028 problem: treasury teams normally address large maturities well beforehand, particularly where leverage is high.
The same change in the price of debt affects capital allocation. Debt reduction has a different economic return when replacement funding costs 7% rather than 3%. Acquisition leverage becomes more expensive, hurdle rates for long-duration investments rise, and liquidity and unused borrowing capacity become more valuable. Share buybacks sit inside the same calculation. If a company generates $500 million of excess cash, carries $500 million of prepayable debt and uses the cash to repurchase shares, it has chosen to carry $500 million more debt than it otherwise would. That does not make the buyback wrong. If management is retiring equity materially below intrinsic value, the expected return may be considerably higher than the contractual saving from reducing debt. But the hurdle has changed, and for weaker borrowers principal reduction can also improve the economics of the next refinancing.
Oil and gas introduces a more difficult interaction because the liability side of the balance sheet does not necessarily move with the commodity price. Brent can fall because supply rises, demand weakens or geopolitical disruption subsides while sovereign borrowing costs remain elevated because of fiscal deficits, issuance, real rates and term premium. An E&P can therefore find operating cash flow falling and leverage rising while the underlying refinancing curve remains expensive. If lower commodity prices also weaken its credit metrics, the corporate spread can widen on top of the high base rate. A refinancing that looked manageable at $90 Brent can become much more difficult at $65 without any corresponding fall in Treasury yields.
There is another problem sitting behind this: resource duration. Shale has given the industry an unusually flexible source of short-cycle supply. Capital can be deployed incrementally, production arrives quickly and activity can be adjusted as commodity prices change. The strategic question is how long the highest-quality shale inventory can sustain that role. The EIA’s current long-term outlook explicitly incorporates depletion of prime acreage, with operators progressively moving into lower-quality inventory with higher costs or lower recovery, partly offset by technology.
The Permian remains dominant and technology can continue, as it has until now, extending its life through longer laterals, refracs, better completions and higher recovery. My concern is not that shale suddenly runs out, but that the economics of the marginal inventory deteriorate. If they do, the loss of an important short-cycle option will have repercussions well beyond the Lower 48. Vaca Muerta and other undeveloped unconventional acreage may provide part of the answer, but the broader question is whether unconventionals can continue to play the role they have played in global supply growth or whether the industry increasingly has to look elsewhere for resource duration.
That increasingly points towards conventional exploration and deepwater development. Wood Mackenzie estimates that production from the world’s 30 largest E&P companies’ currently commercial portfolios declines by nearly 40% between 2025 and 2040. It also estimates that today’s onstream fields would provide around 700 billion barrels against almost 1 trillion barrels of cumulative liquids demand through 2050 in its base case, leaving a supply gap of roughly 300 billion barrels without improved recovery, new projects or discoveries.
Majors are already showing renewed interest in high-impact and ultra-deepwater exploration. Those barrels have a very different capital profile from shale. Exploration capital is spent before commerciality is known; successful discoveries then require appraisal, concept selection and, in many cases, billions of dollars of development expenditure before first production. The eventual fields may provide long-duration cash flow, but the capital is committed much earlier and remains at risk for much longer before the return is received.
If high-quality shale inventory gradually becomes scarcer while the cost of capital remains elevated, the industry may need to commit more capital for longer just as that capital becomes more expensive. Lower oil prices make the tension worse because internal cash generation falls and marginal shale locations become less competitive while the strategic need to replace resources remains. A leveraged independent can therefore reach a point where the subsurface case for a deepwater development is attractive but the balance sheet cannot tolerate the duration of the investment. The CFO can be right to reject the expenditure even when the subsurface team is right about the resource.
Tullow is an unusually clear example of how the liability structure can dominate the discussion because the company is already paying distressed-credit economics. Its recent refinancing included approximately $1.21 billion of senior secured notes due November 2028 carrying 10.25% cash interest, 3% PIK and a further 1.75% pay-if-you-can component. The Glencore exposure became roughly $423 million of junior secured notes due May 2030 at SOFR plus 12.75%, entirely PIK, stepping up by another 75bp when Brent exceeds $65/bbl.
The issue is therefore not that another 200bp suddenly makes the debt expensive; it is eye-wateringly expensive already. Applied to the Glencore principal at completion, a further 200bp adds around $8.5 million a year, but because that interest is capitalised the immediate effect is to increase the liability rather than consume cash. The senior notes are fixed-rate and do not reprice. Tullow’s immediate rate sensitivity therefore looks smaller than that of some much stronger companies, while its more important exposure is the amount of senior capital that still has to be repaid or refinanced around 2028.
If roughly $1.2 billion ultimately had to be refinanced with the base curve 200bp higher, that alone would add around $24 million of annual interest if Tullow’s spread were unchanged. For a capital structure that has recently required a distressed refinancing, an unchanged spread is hardly the obvious downside case. A further 500bp of spread widening would take the all-in deterioration to 700bp, or around $84 million a year. Those are scenarios rather than forecasts, but they show why paying down principal before 2028 has value beyond saving the current coupon: it reduces the amount that must eventually be negotiated with creditors in whatever market exists at the time.
Kosmos is less extreme but feels rate movements more immediately. Its capital structure includes a reserve-based lending facility, a Gulf of America secured term loan, secured Nordic bonds, unsecured notes and convertible debt. The RBL borrowing base is approximately $1.2 billion and the company is already refinancing it, while the Gulf facility is also floating-rate and carries SOFR plus 3.75%. Around $1 billion of floating bank and term debt is a reasonable order of magnitude for the immediate sensitivity, which means another 200bp would add roughly $20 million of annual cash interest.
Unlike Tullow’s PIK exposure, that cash leaves the business as it is incurred. Kosmos is trying to reduce leverage as Jubilee performance improves, GTA contributes and asset sales release capital, so higher floating interest consumes part of the cash that would otherwise accelerate deleveraging.
The RBL refinancing means the spread matters at the same time as the base rate. Kosmos has already demonstrated the price of speculative-grade capital through the $350 million secured Nordic bond it issued earlier this year at 11.25%. Better operating performance may help the next financing margin, while a weaker commodity environment would work in the other direction. This leaves Kosmos at the intersection of asset improvement and capital-market dependence. It still needs investment to support the future portfolio, but every dollar absorbed by debt service or deleveraging is a dollar unavailable for that investment.
Energean adds a different form of concentration risk. Founder and CEO Mathios Rigas built the company from a small Greek producer into a substantial Mediterranean E&P, with the transformational step coming in 2016 when Energean acquired Karish and Tanin offshore Israel. It subsequently financed and developed Karish through the Energean Power FPSO, brought the field onstream in 2022 and broadened the portfolio through the Edison E&P acquisition. By 2025 the company had grown to more than 150kboe/d, with Israel at the core of its cash generation.
Karish sells substantial gas volumes into the Israeli market under long-term contracts, but the 41-day government-ordered shutdown in early 2026 showed that even contracted cash flow can disappear temporarily while debt remains. Q1 revenue and EBITDAX fell, net debt increased to more than $3.3 billion and leverage moved above 3x. Production subsequently returned, but the episode provided a real stress test of the EBITDA supporting the capital structure.
Energean has long-dated fixed-rate notes alongside material floating bank debt. The $750 million Bank Leumi term loan includes a dollar tranche priced at SOFR plus 4.25% and a shekel tranche linked to the Bank of Israel rate, while other facilities add further floating exposure. A 200bp move on the $750 million loan alone adds about $15 million of annual cash interest. The company also has $625 million of 5.375% notes due in 2028. If those notes refinance against a base curve 200bp higher, the base-rate component alone adds $12.5 million annually before any change in Energean’s own spread.
Neither figure is alarming by itself. Their interaction with the operating profile is more important. Energean accumulated much of its leverage building a long-duration gas business, but that makes the timing and reliability of cash flow important. The company is still funding developments while relying heavily on a core asset base that has demonstrated geopolitical interruption. Another production shock, weaker commodity prices or additional development expenditure could increase leverage just as the bond market begins to price the 2028 refinancing. Shareholder distributions sit inside that equation as well. Energean returned $221 million to shareholders in 2025 and subsequently reduced the first-quarter dividend after the Israeli shutdown. Cash distributed cannot reduce the principal or leverage with which the company enters its next refinancing.
Harbour removes financial distress from the discussion and instead raises a capital-allocation question around shareholder returns. Following the $3.2 billion LLOG acquisition, Harbour ended June with around $5.4 billion of net debt but leverage of only 0.7x. It remains investment grade, has substantial liquidity and expects around $1.8 billion of free cash flow for 2026, so there is no obvious access-to-capital problem.
The LLOG acquisition is interesting because Harbour increased its floating-rate exposure just before the rate environment became materially less benign. The transaction introduced a $1 billion three-year term loan at SOFR plus 1.467% and a $1 billion bridge facility linked to SOFR. Harbour has also used interest-rate swaps to convert some fixed-rate bonds into floating liabilities. If those swap positions remain broadly intact, effective floating exposure is around $3.7–3.8 billion, meaning a 200bp increase would represent approximately $75 million of gross annual interest sensitivity. Harbour’s cash balances provide some offset, but the exposure is large enough to change the relative economics of debt reduction against shareholder distributions. The financing was deliberately structured to be flexible and repayable, but Harbour effectively entered 2026 with more floating-rate exposure just as the cost of that exposure was becoming more uncomfortable.
The other side of Harbour’s liability structure is equally interesting because it inherited very cheap euro debt through the Wintershall Dea transaction, including €1 billion of 1.332% notes due in 2028 and another €1 billion at 1.823% due in 2031. Those liabilities are valuable. A 1.332% coupon remains 1.332% until maturity, but Harbour has already demonstrated what replacement debt costs in the current market: its $900 million notes due 2035 carry a 6.327% coupon. The future refinancing step-up is therefore considerable even before another 200bp rise in rates.
Harbour’s shareholder-return policy makes the capital-allocation choice particularly tangible because the decision is very recent. On 6 August, alongside its half-year results and an increase in 2026 free-cash-flow guidance to around $1.8 billion, Harbour announced a new $250 million share buyback and said total shareholder returns for the year would be at least $800 million, including at least $500 million of additional cash returns above the annual dividend. The decision was therefore made after completion of LLOG and in the same higher-rate environment discussed here, rather than representing the continuation of a capital-return policy set when debt was materially cheaper.
There is a perfectly credible case for the buyback. Leverage is low, liquidity is strong and management may reasonably believe the shares are materially undervalued. If the equity is being bought substantially below intrinsic value, the return from retiring it may comfortably exceed the cost of debt. But the buyback cannot be separated from the liability structure created partly by LLOG. The $1 billion term loan is prepayable, so if Harbour spends $250 million repurchasing shares rather than reducing that loan or other floating acquisition debt, it has chosen to carry $250 million more debt than it otherwise would.
If the all-in cost of that floating debt were 7–8% after a further 200bp rate increase, using the same $250 million to reduce debt would avoid roughly $17.5–20 million of annual pre-tax interest. At $500 million the equivalent would be around $35–40 million. That does not prove the buyback is wrong; it establishes the hurdle against which a decision made now, with today’s financing costs already visible, should be judged. Repaying the acquisition debt rebuilds financial capacity, while buying back shares uses some of that capacity to exploit management’s view of the equity valuation. Harbour has chosen to do both, but the higher the price of debt becomes, the more demanding the case for the shareholder-return side of that allocation becomes.
BP takes the discussion into a different credit category because the issue is not whether it can refinance. It is what repeated episodes of value destruction have done to the financial capacity available to the company today. BP enters a more expensive financing environment with significantly less balance-sheet freedom than several of its major peers.
At the end of 2025, $16.7 billion of BP finance debt was effectively floating after swaps, and BP disclosed that a 100bp movement in applicable rates would change annual finance costs by about $167 million. A 200bp stress therefore implies roughly $334 million of gross annual liability-side sensitivity. BP can absorb that. It carries substantial cash balances, much of its debt remains fixed for years and there is no meaningful question over access to capital markets. The more important issue is what repeated calls on the balance sheet have done to its strategic flexibility.
Macondo generated roughly $66 billion of cumulative pre-tax charges and forced BP to spend years selling assets and rebuilding the balance sheet. Russia subsequently removed access to a Rosneft investment carrying around $14 billion of book value immediately before the invasion of Ukraine. Those events were fundamentally different. Macondo followed a catastrophic operating failure for which BP bore responsibility; the loss of Rosneft was the consequence of country risk BP had chosen to take. Both consumed large amounts of financial capacity that had previously belonged to its shareholders. But that was not all.
BP’s transition strategy is arguably more revealing because it was an explicit capital-allocation choice. The company entered the 2020s with substantial leverage and chose to direct an increasingly large proportion of investment towards businesses whose valuations were particularly sensitive to the cost of long-duration capital. Transition investment rose from around 3% of total investment in 2019 to around 30% in 2022, with BP subsequently planning for more than 40% by 2025 and around 50% by 2030. Offshore wind, solar, hydrogen and other transition businesses were being scaled during a period of exceptionally low discount rates.
Rates then rose sharply and some of those economics did not survive the change. BP recorded $1.14 billion of impairments against its US offshore wind investments in 2023 and subsequently took further multi-billion-dollar impairments across renewables and other transition businesses. It has since substantially reduced planned transition investment and redirected capital towards oil and gas. This was not a geopolitical shock imposed on BP. The board and management chose the strategy, chose the pace of capital deployment and chose to make those commitments while maintaining a balance sheet that offered less room for error than several competitors.
BP is now rebuilding financial capacity again. Net debt is being pushed towards $14–18 billion by the end of 2027 and buybacks have been suspended while cash is directed towards balance-sheet repair. Higher rates increase the return from deleveraging, but they also raise the cost of having to deleverage now. Capital that could otherwise fund exploration, acquisitions, long-cycle developments or shareholder distributions is being used to restore capacity lost through earlier events and decisions.
The comparison with Exxon, Chevron and Shell is therefore not simply about leverage ratios. It is about optionality. Stronger balance sheets allow a major to keep funding exploration through a weak commodity cycle, carry large developments for longer, acquire assets when sellers need liquidity and tolerate greater uncertainty over the timing of returns. BP can still do all of those things, but it does so while significant cash generation is committed to repairing the balance sheet.
If the industry increasingly needs capital-intensive deepwater exploration and development to supplement maturing shale inventory, that difference becomes more important. Macondo destroyed enormous value through operating failure. Rosneft removed a valuable source of reserves, production and cash flow through country risk. The transition strategy then committed capital voluntarily to businesses whose economics proved far less robust once discount rates normalised. The events were different, but their cumulative effect is visible in the same place: the financial capacity BP has available today.
For investors, higher financing costs can create an opportunity at the other end of the sector. A leveraged producer facing an approaching maturity may stop bidding for assets it would previously have pursued, while another may decide that a non-core field is worth more as sale proceeds applied to debt than as retained production. A company with a good discovery may seek a farm-down because it cannot comfortably carry its share of appraisal and development. Financial buyers face the same arithmetic: if acquisition leverage becomes materially more expensive, some private-equity or highly leveraged strategic bidders can no longer justify the prices they could offer when debt was cheap. The bidder universe can shrink at the same time as the number of motivated sellers increases.
For companies with strong balance sheets, that can be an attractive acquisition environment. They can fund acquisitions from cash flow, liquidity or investment-grade debt while competitors have to price the same assets through a materially higher marginal cost of capital. It may not even be necessary to wait for conventional distress. Once a restructuring is under way, creditors influence the process and assets may already have suffered from underinvestment. Earlier in the cycle, a leveraged seller may still control its portfolio but place a much higher value on cash because it can see the maturity wall approaching.
The same logic applies to resource duration. A smaller company can own a technically attractive deepwater discovery and still be the wrong long-term owner if it cannot fund appraisal and development efficiently. The quality of the resource has not changed; the balance sheet capable of carrying it has. That can lead to farm-downs, asset sales or corporate transactions in which long-duration resources migrate towards stronger capital structures.
Tullow’s immediate floating-rate cash sensitivity is small, but the terms of its next major refinancing could determine how much value remains for equity. Kosmos has meaningful floating cash exposure while refinancing its RBL. Energean combines development leverage with concentrated operating risk and a significant fixed maturity approaching in 2028. Harbour has the luxury of choosing between deleveraging, buying its own shares and preserving capacity for future transactions. BP can refinance easily, but past decisions have left it with less financial freedom than stronger major competitors as capital becomes more expensive.
A 200bp rate sensitivity is therefore only the first calculation. It measures something useful for floating debt, but says much less about cheap fixed debt approaching maturity and almost nothing about the spread at which a leveraged borrower will eventually refinance. For an oil and gas board, the more useful analysis combines floating-rate exposure, the fixed-rate maturity profile, hedging, prospective credit spreads, liquidity, shareholder distributions, acquisition capacity and the amount of capital the portfolio will require to sustain its future resource base. The downside case also needs to allow oil prices and financing costs to move independently. Expensive sovereign debt does not guarantee expensive oil.
Balance-sheet capacity consequently determines more than financial resilience. It influences whether a company can keep investing when the commodity cycle turns, whether it can fund exploration while competitors retrench, whether cash should be returned or retained, and whether tighter capital markets should be treated principally as a refinancing threat or as an opportunity to acquire resources from companies that can no longer finance them as efficiently.