Majors Diversification Ledger: Data Pack
The working Excel ledger behind Equinor Bought What Eni Was Selling: acquisitions, disposals, impairments and transaction marks for BP, Shell, Equinor, Eni and TotalEnergies since 2017, every figure sourced.

Data pack · November 2026 · 5 companies
The working Excel ledger behind Equinor Bought What Eni Was Selling. It records what BP, Shell, Equinor, Eni and TotalEnergies have paid for and received from their diversification into power, renewables and biogas since 2017, one disclosed transaction per row, with every figure tied to a source.
How to use it
- Start on the Summary tab: one row per asset, with cash, enterprise value, debt, commitments and unrealised marks in separate columns.
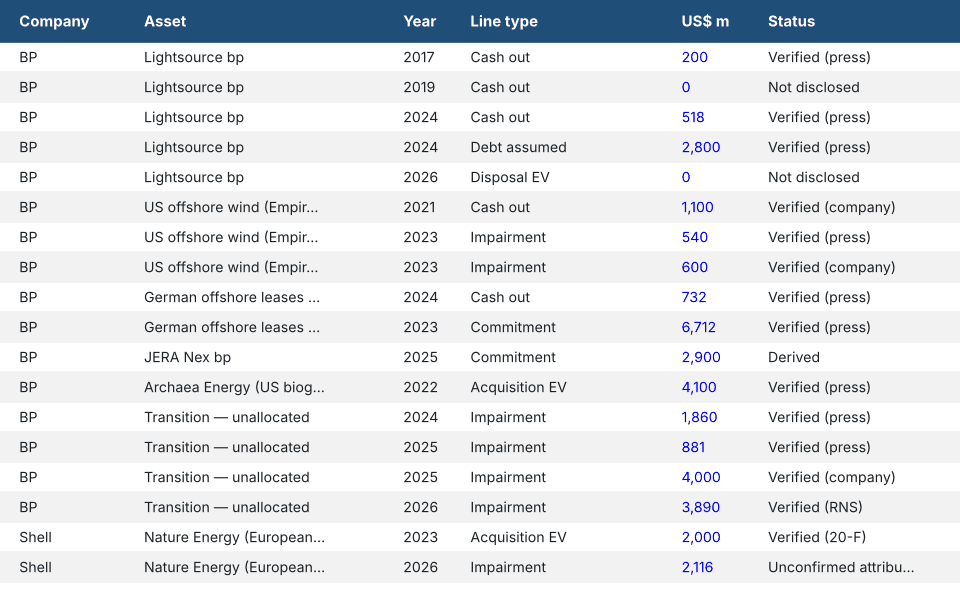
- Drill into the Ledger tab for the individual transactions. The Status column says whether each figure is verified, derived or still to confirm.
- Blue numbers are inputs from filings, yellow cells are assumptions or gaps you can override, and every result is a formula.
- The Sources tab links every figure to the announcement or filing it came from, and Open_Items lists what is still unresolved.
What is in the workbook
- Summary: one row per asset. Results show only where the inputs are complete; nothing is added across different bases, and there are deliberately no totals.
- Ledger: around 60 disclosed events, from BP's 2017 entry into Lightsource to the October 2026 Plenitude reorganisation, in native currency and US dollars.
- Impairments: disclosed write-downs by company and year, with pre-tax and post-tax charges kept in separate tables.
- Comps: transaction marks per megawatt and per unit of EBITDA, with the asset perimeter and debt treatment shown alongside every price.
- Alternatives, Offshore_Test and Recycling_Test: illustrative models of an outright versus partner exit for Lightsource bp, Germany's 2023 seabed bids against offshore project economics, and the develop-build-sell-down cycle used by TotalEnergies. These are analytical tools, not valuations.
- Metrics, Assumptions, Open_Items and Sources: segment data, exchange rates, unresolved disclosures and source links.
Reading the numbers
The ledger keeps four things apart that are often blurred together: cash actually paid or received, enterprise values that include debt, accounting impairments, and unrealised market values. An impairment is an accounting judgement about carrying value, not a cash loss, and a minority sale at an attractive valuation does not prove that the original investment earned its cost of capital. Where a company has not disclosed a figure, the cell is left blank and flagged rather than estimated.
The workbook keeps original currencies and transaction dates. The article translates figures into US dollars at a single 30 October 2026 rate for comparability, so its dollar amounts differ from the historical-rate figures here.
Version history
Version 3, 3 November 2026. BP's impairment rows now follow BP's own split in its Annual Report 2025. FY2024 is shown as not disclosed, because BP does not itemise transition charges for that year (version 2 used a $1,860m segment figure that also included gas assets). FY2025 is now $3,537m on the transition businesses plus $1,082m through joint ventures, both pre-tax (version 2 combined a $881m nine-month segment figure with a $4,000m group-wide post-tax figure). The nine-month 2026 description and the Summary and Impairments notes are updated to match, and the Annual Report is added as a source. The changes are also logged on the Cover tab.
Version 2, 1 November 2026. First published version. It stays available above so readers can see what changed.
Version 3, 3 November 2026. Figures from company announcements, results and filings, supplemented by press reports where filings were not available; each row is flagged accordingly. For information only; not investment advice.